Analytics Dashboard
Monitor your business performance with real-time transaction metrics, revenue trends, and settlement tracking.
The Analytics Dashboard gives you a real-time snapshot of your business performance. Use it to monitor daily transactions, track revenue trends, and quickly identify any issues that need attention.
Accessing the Dashboard
Navigate to HOME > Dashboard from the sidebar, or click the Doitpay logo to return to the dashboard from any page.
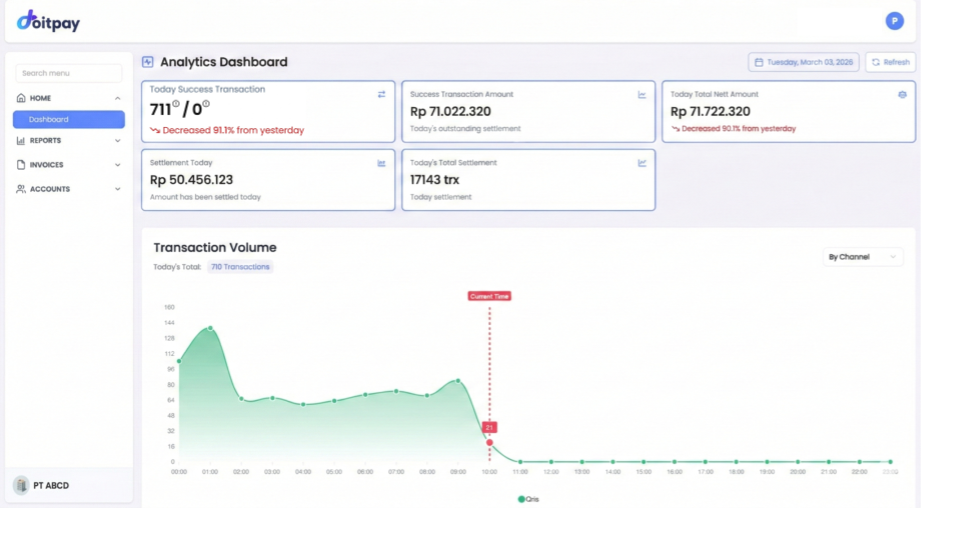
Understanding the Summary Cards
At the top of the dashboard, you will see five key metrics:
Today Success Transaction
Shows successful transactions versus total generated (e.g., "90/100" means 90 successful out of 100 generated). The percentage below compares to yesterday's performance.
Success Transaction Amount
The total gross amount from successful transactions today (e.g., Rp 71,022,320).
Why it matters: This is your daily revenue before fees and settlements.
Today Total Nett Amount
Your net earnings after transaction fees are deducted (e.g., Rp 71,722,330).
Why it matters: This represents your actual take-home amount.
Settlement Today
Amount that has already been settled to your bank account today (e.g., Rp 50,456,123).
Why it matters: Track how much has moved from Doitpay to your bank.
Today's Total Settlement
Number of settlement transactions processed today (e.g., 17,143 trx).
Why it matters: Verify settlement activity matches your expectations.
Tip
Green percentages indicate improvement from yesterday. Red percentages indicate a decrease. Use these trends to spot patterns in your business.
Transaction Volume Chart
The chart visualizes your transaction patterns over time:
- Today's Total: Shows total transaction count for the selected period
- By Channel dropdown: Filter to see transactions by specific payment method (Virtual Account, QRIS, E-Wallet, etc.)
The chart displays hourly transaction volume, helping you identify peak times and unusual dips.
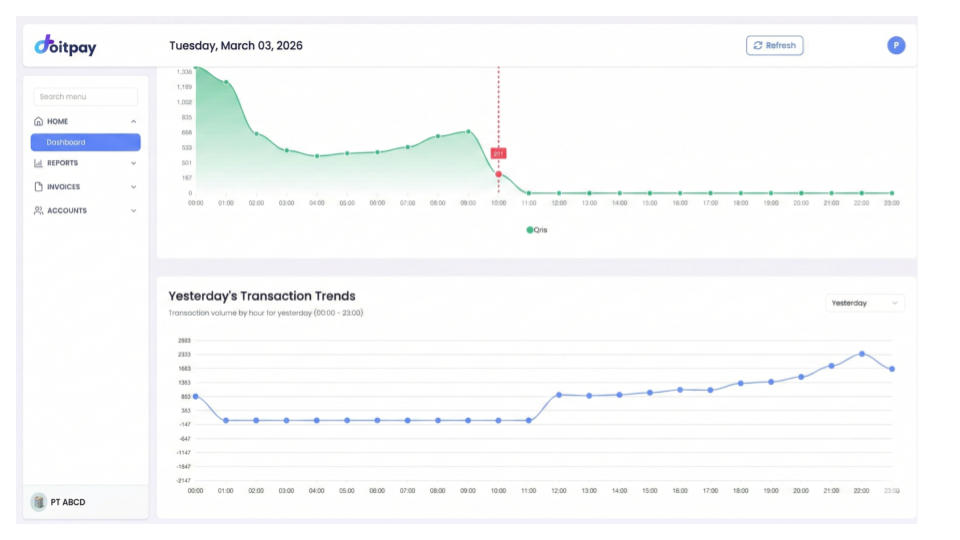
Yesterday's Transaction Trends
Below the main chart, the Yesterday's Transaction Trends section shows the hourly transaction pattern from the previous day. Use this as a baseline to compare today's performance.
Note
If you see "No data available," it means there were no transactions for the selected period and filters.
Refreshing Data
Click the Refresh button to update the dashboard with the latest data. This is useful if you are monitoring transactions in real-time.
Common Questions
Q: Why does my Success Transaction Amount show Rp 0?
This means no successful transactions have been recorded for the selected date. Check if you have the correct date selected, or verify that transactions are being processed correctly.
Q: What time zone is used for the dashboard?
All times are displayed in Western Indonesian Time (WIB/UTC+7).
Q: How often does the data update?
Data updates in near real-time. Click Refresh to see the latest figures.
Q: Can I see data for multiple days?
Yes, use the date picker to select a date range. For detailed historical analysis, use the reports in the REPORTS section.